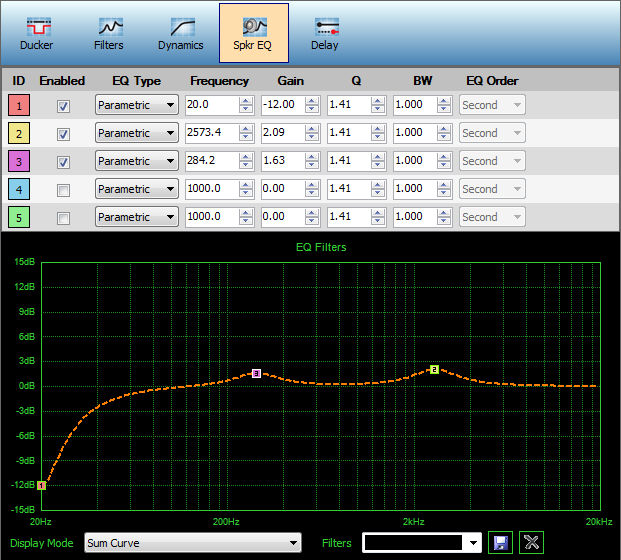

Speaker EQ gives additional equalization capabilities at the output stage of an output channel. Up to eight separate Filters can be implemented per audio channel. A possible use for this set of filters would be to EQ a room or certain speaker type as required. To add a Filter, simply click the Enabled checkbox beside the filter and enter the settings required in the dropdown boxes. The EQ Filters field also allows clicking and dragging on the filter to adjust settings. Finally, the Display Mode can be toggled between Individual Filters, Individual Filters & Sum Curve, and Sum Curve.

This Dropdown can be used on multi channel devices to select the channel that requires adjustment
The ID number of the EQ filter gives the user a colored representation in the EQ Graph. Clicking once on the ID number will enable an EQ filter.
This checkbox is used to enable an EQ filter. Once a filter is enabled, it will appear in the EQ Graph.
Vocia Devices have multiple EQ Types that can be used to shape an audio signal. These filters can be selected using the EQ Type dropdown box. Accessible types include Parametric, High Shelf, Low Shelf, Notch, Band Pass, Low Pass, High Pass, and All Pass.
This menu item determines the center frequency for the EQ filter type selected.
This control adjusts the amount of cut or boost applied at the center frequency for certain EQ filter types. This parameter is specified in dB relative to the nominal level of the Vocia Device.
Q (or Efficiency Factor) is another method of expressing the bandwidth of a filter (Q is a ratio defined as the center frequency divided by the bandwidth). If the Q is specified as the value for a filter, an equivalent bandwidth value will populate the adjacent Bandwidth box (labeled BW), and vice versa.
BW (or Bandwidth) determines the width of the filter curve. The value is expressed in octaves between the lower and upper 3-dB points of the filter curve.
This window is only adjustable when a Pass Type filter is selected. First and Second Order filters are available (6 or 12 dB per octave, respectively).
The EQ Filters Graph displayed on the screen assists with a visual representation of changes made during filter configuration. It has a number of features that can be used to change the visual representation. Please note that instead of entering frequency and gain values for a filter, draging handles on filter curve into their required positions on the graph is supported (by clicking and dragging the handle into the required position). Similarly, holding down the Shift key while dragging will change the bandwidth or Q of a filter. Some or all of the filters may be selected and moved on the graph as a group. To select a group, right click and hold, which will create a box around the group, and then release when the box is defined. This selects all curves with handles inside the box.
The selected curves may then be manipulated as a group (by clicking and dragging any of the selected handles). To deselect the group click anywhere within the graph. Alternatively, CTRL-clicking allows progressive selection or de-selection of individual filters.
This dropdown box is located under the EQ Graph and is used to change the visual representation of filters in the graph. The three options include: Individual Filters, Both Individual Filters and Sum Curve, or Sum Curve.
This dropdown box is used to Save, Recall, and Delete EQ filter files, which can be saved to the local PC for later use in other Vocia devices or systems. To recall a filter file, select the dropdown box and all filter files stored on the local PC will be shown. Then select a filter file and it will populate the screen.