The Log Viewer function is found both in the Network Menu and the Network Toolbar or as a keyboard shortcut by pressing Ctrl + L. It displays historically logged information relating to the active configuration and any device that is or has been Online and operational. This information may be used to verify system operation and for debugging purposes. The details of information logged depends on the Device.
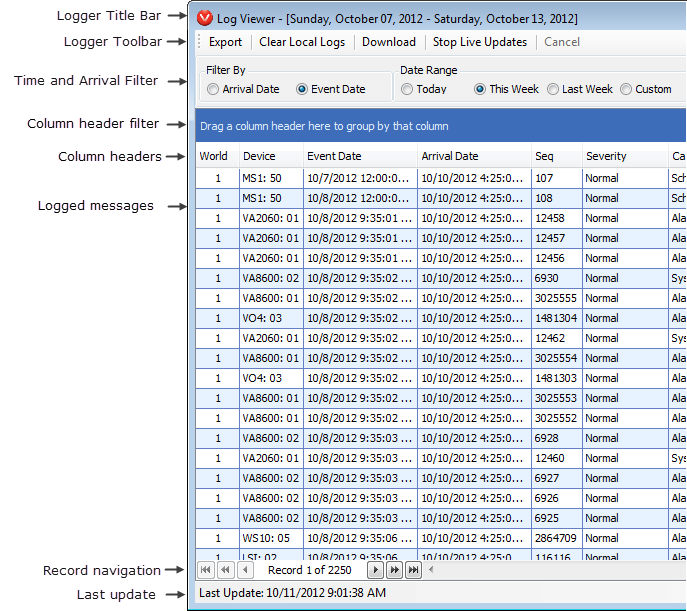
This will display the current Time and Arrival Filter settings.
The Logger Toolbar can be used to export, clear local logs, Download logs, Stop or Start Live updates or Cancel a logging update.

Export will generate an .xml or .txt file of the Log Viewer’s contents. This can be saved to a file location and sent to Biamp technical support or archived.
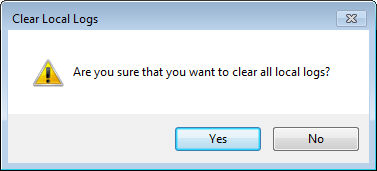
Clear Local Logs is used to clear out all Device Logs from the local PC. A Confirmation Dialog will appear if this menu item is selected to ensure that this information is not accidentally deleted, as this action is irreversible once completed.
Download is used to request logs from the system based on the currently active filter.
Stop Live Updates is a toggle menu item which enables or disables live update of the Device Logs.
Cancel can be used to stop loading the logging table when records are being filtered.

Filtering can be enabled between the logging database and the event log.
Filter By allows the table to be filtered by Arrival Date or Event Date.
Date Range allows a date range to be specified. Selectable date filters include:
Today - The Log messages will only include items with the current days date.
This week - The Log Messages will include items from the last 7 days.
Last week - The log messages will include items between the last 7 and 14 days.
Custom will allow a custom date range to be selected from the Start Date and End Date fields.
Apply Filter will update the table with the new filtered information.
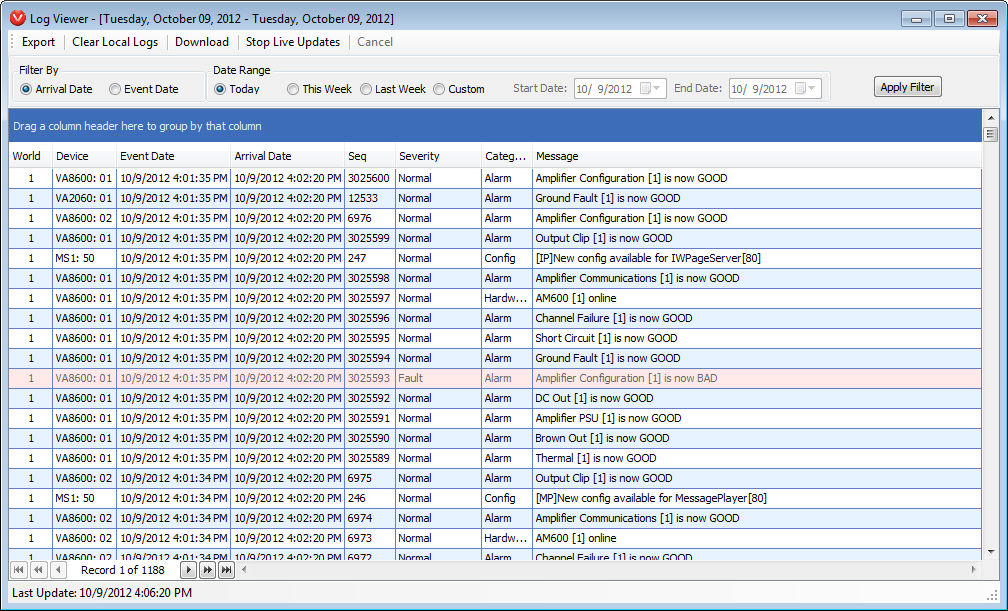
The main area of the logger shows the Logged device information. This is shown in a table format with alternate allows for readability. There are also a number of filter options to aid finding a particular log entry.

At the top of the table is a Column Header Group by Box feature. This allows the column headings to be dragged into the Blue area and will filter any results in the table below. The column headings can be added and sorted to adjust the filtering. Selecting the Filter By, Date Range or Apply Filter settings will reset the Group By Box settings.
Columns within the Log Viewer dialog window are used to display information logically. The columns are titled World, Device, Event Date, Arrival Date, Seq, Severity, Category and Message. Each column also enables filtering. If you click the column heading it will sort by that column. Any Log Event that is deemed to be a fault by the Vocia software will be colored Red in the Log Viewer. Normal messages will be uncolored or Blue.
World - This Column will report the World Number.
Device - This column will report device type and ID.
Event Date - Column will display the log event date and time.
Arrival Date - Column will report the date and time that the log was received by the local PC.
Seq - Column will report the sequence number of the log event. Sequence numbers are generated per device.
Category - Column will display the type of log that has been generated by the device.
Severity - Column will display the severity level of the alarm. Fault Messages are displayed in red.
Message - Column will contain a brief message that details the log event.
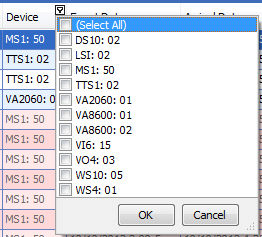
Additionally selecting the small filter icon that appears when hovering over the column heading will allow selection of specific items.
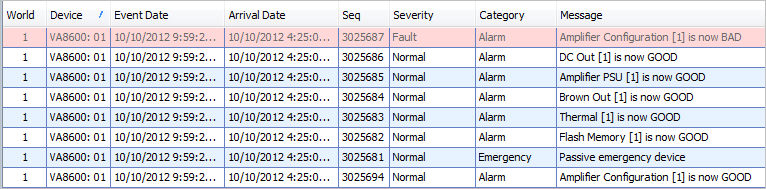
The log messaging is in a table format. To make line referencing easier alternate rows are shaded, Any alarms that indicate as bad will indicate by a red cell shading..
For resolved Alarms the Message column will report the Alarm status as "is now GOOD" with rows shaded white (no shading) and light blue.
For Unresolved Alarms that require attention the Message column will report the Alarm status as "is now BAD" and the rows will be shaded in light red and dark red.

In the example below a new configuration is sent to an amplifier. As you can see the logger displays that the configuration moves to 'BAD' and then back to 'GOOD' once complete. The other messages are displayed to show the amplifier services being verified as it comes back online after the reconfigure.